Train + plane
Flights leaving the 17 airports linked to the rail network, and a planner that tells you which train to take to reach your flight with time to spare.
Someone recommended it to you
Trenalia is a website to know what is happening with trains in Spain, made for people who take them every day. It works on your phone, with nothing to install and no account.
On the map, almost in real time, and how long until it reaches your station.
Before you leave home, with the real time you will arrive.
Your station board in your pocket, with the platform when it is published.
Which connection awaits you when you arrive: another train, metro, bus or bike.
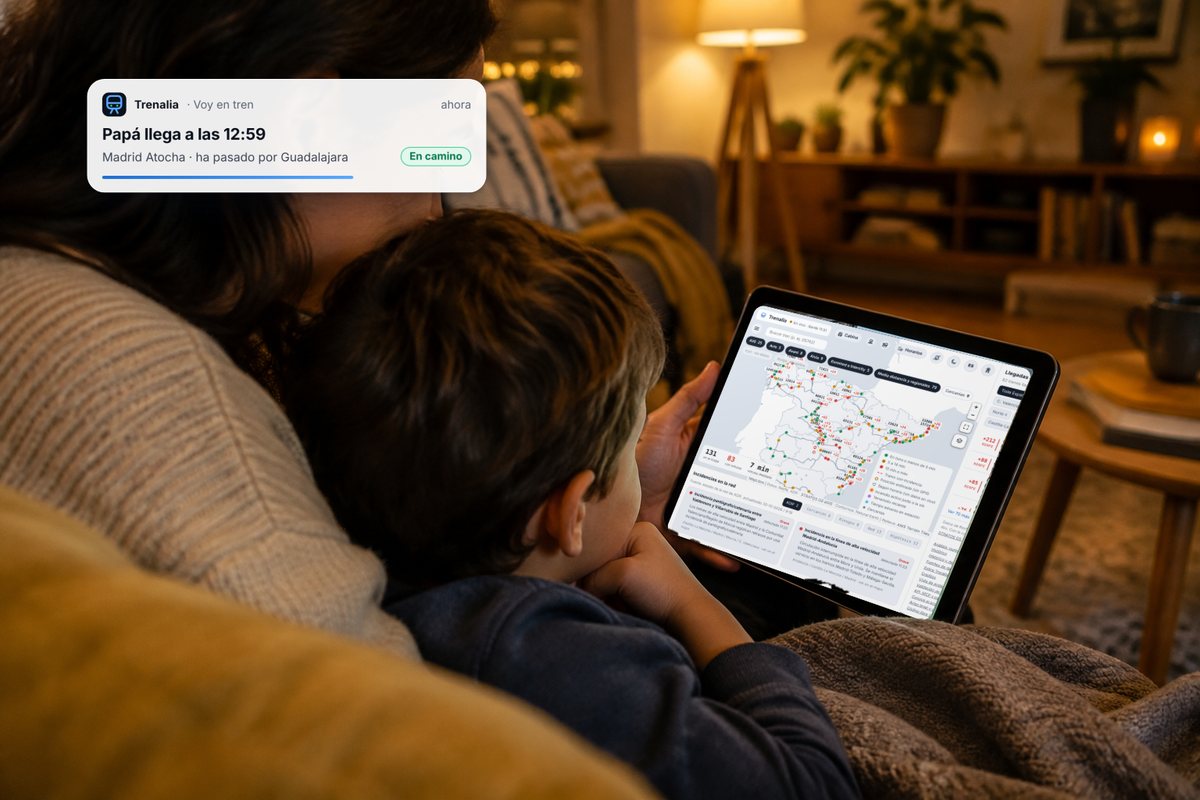
Send a link to your family: they will see where you are and when you arrive.
Delay, cold, packed train? Report it and help other travellers.
Public data from Renfe, Adif and the official timetables: it may be delayed or contain errors. Trenalia is not related to Renfe or Adif.
Spain's trains on a map, in near real time.
Trenalia brings together in one place the positions, delays, timetables and incidents published by Renfe, ADIF and other open sources, and explains them clearly. Check timetables, plan a journey with connections or ask Trenalito. It is an independent, non-profit project.
And we want to go further: to be a citizen network that collects data on the state of the railway. The phones we carry on the train can pick up anomalies in trains and track; combined with the incidents and delays travellers share, and processed by Trenalia, they let us identify over time which sections are causing problems.
It is an experimental tool for information only. Positions and times are estimates. It is not for driving trains or for making safety decisions.
| Train | Destination | Next stop | Delay |
|---|---|---|---|
| Connecting to Trenalia… | |||
Real data read just now from the Trenalia server.
🆕 New in November
Trenalia no longer looks only at the train: it also covers flights, roads and mobile coverage around your journey. And Trenalito answers it all: “are there roadworks on the A-4?”, “how many planes are over Madrid?”.
Flights leaving the 17 airports linked to the rail network, and a planner that tells you which train to take to reach your flight with time to spare.
A new layer with live airline flights over Spain, using open data from OpenSky Network and adsb.lol. No private or military aircraft.
Official DGT roadworks, closures, accidents and queues, every 5 minutes, on each station’s page and on the map. So you get to your train on time.
Where your phone loses signal, measured anonymously by travellers themselves with “I’m on the train”.
The reader understands Renfe’s QR code and the Aztec code on tickets, on your own phone, without sending your ticket anywhere.
The full route, by car or bus to the station, then the train and the last leg, with our own routing engine on OpenStreetMap. And Trenalia in Portugal and France.
🚇 New · Metro and tram
Zoom into your city on the map to see its lines in their colours, its stations and the trains moving. Tap a station for the next departures and the operator’s notices, or tap a train to see where it is and when it reaches each stop.
Metro train positions are estimated from each operator’s official timetable (metros do not publish GPS); in Bilbao and on the Euskotren tram they are corrected with the real delay.
📰 New · Every week
What happened on Spain’s trains told with data, travel stories and what’s new in Trenalia. Read it on the web, download the PDF or get it every Monday in the newsletter. In Spanish.
Got an idea for the magazine? We can’t wait to hear from you: destinations, trains with a story, data you’d like explained… Your suggestions help us shape the next issues. Send us your idea →
📱 Big news · Apps for iPhone and Android
On top of the web app you already use, we're publishing the Trenalia apps on the App Store and Google Play. The app follows your train in the background, sends you notifications even when Trenalia isn't open and keeps the automatic SOS watching with the phone in your pocket.
✈️ Trenalia on Telegram
Join the channel to hear right away about major incidents, strikes, storms and the daily summary. And use the bot so it only writes to you about your own things, every day: your train, your station, your Cercanías line or your area.
How to use the bot, step by step → · Free. The bot does not keep your name or phone number; “borrar” deletes everything.
🚨 New · Automatic SOS
Turn on automatic SOS in «Voy en tren» and choose who to alert. If the phone feels a very strong impact, or you hold the alarm button, Trenalia sends your contacts an email and a Telegram message with your train, your GPS position and the train’s position.
Trenalia does not alert 112 or any emergency service: only your contacts. In an emergency, call 112. It works with the page open and the screen on.
Trenalia in 30 seconds
Trenalia brings together on one website, free and with no sign-up, everything you need to know about trains in Spain: where each train is, how late it is and which source that figure comes from, the timetables for any day, and the incidents and risks along the line. It helps you plan journeys with connections, alerts you if your train is running late even when the website is closed, lets you send your family a link so they can see where you are, and answers your questions through Trenalito. For anyone studying the network it adds measured punctuality, reports, open data, an API, connectors for AI assistants and a “what if…?” simulator. Always with public data, and always saying what is official data and what is an estimate.
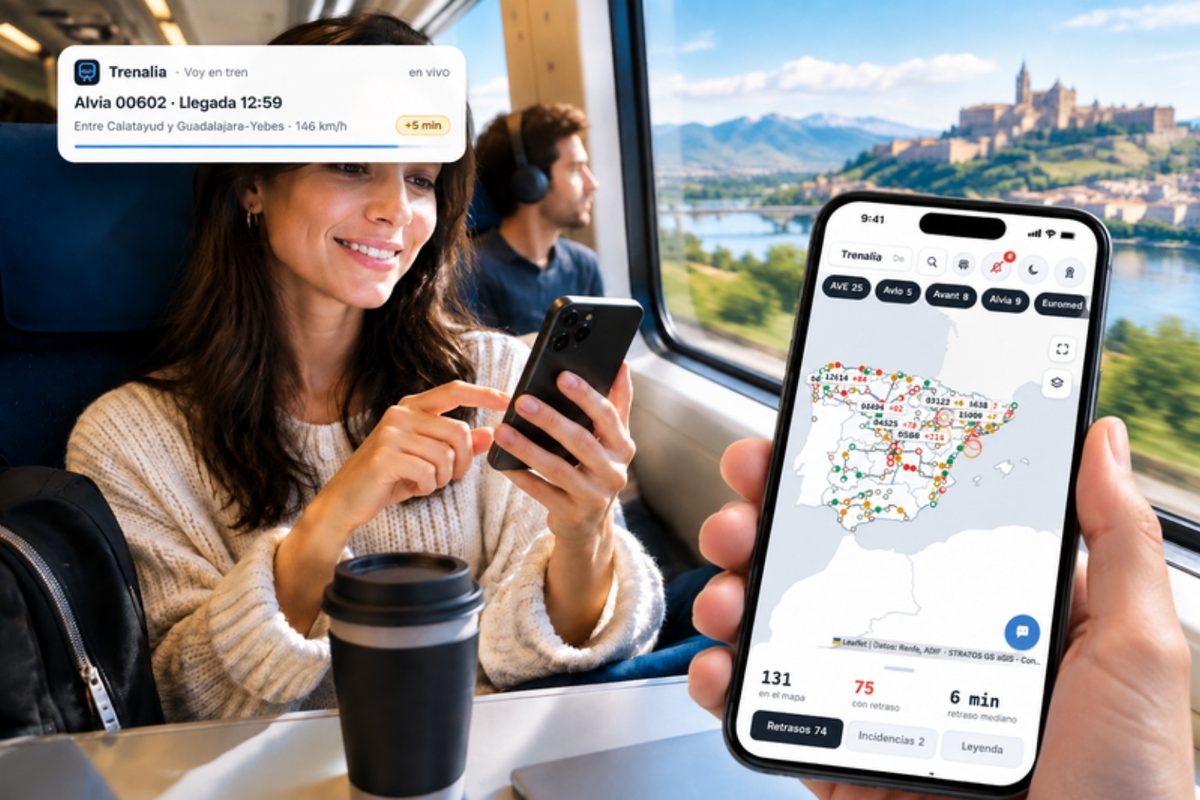




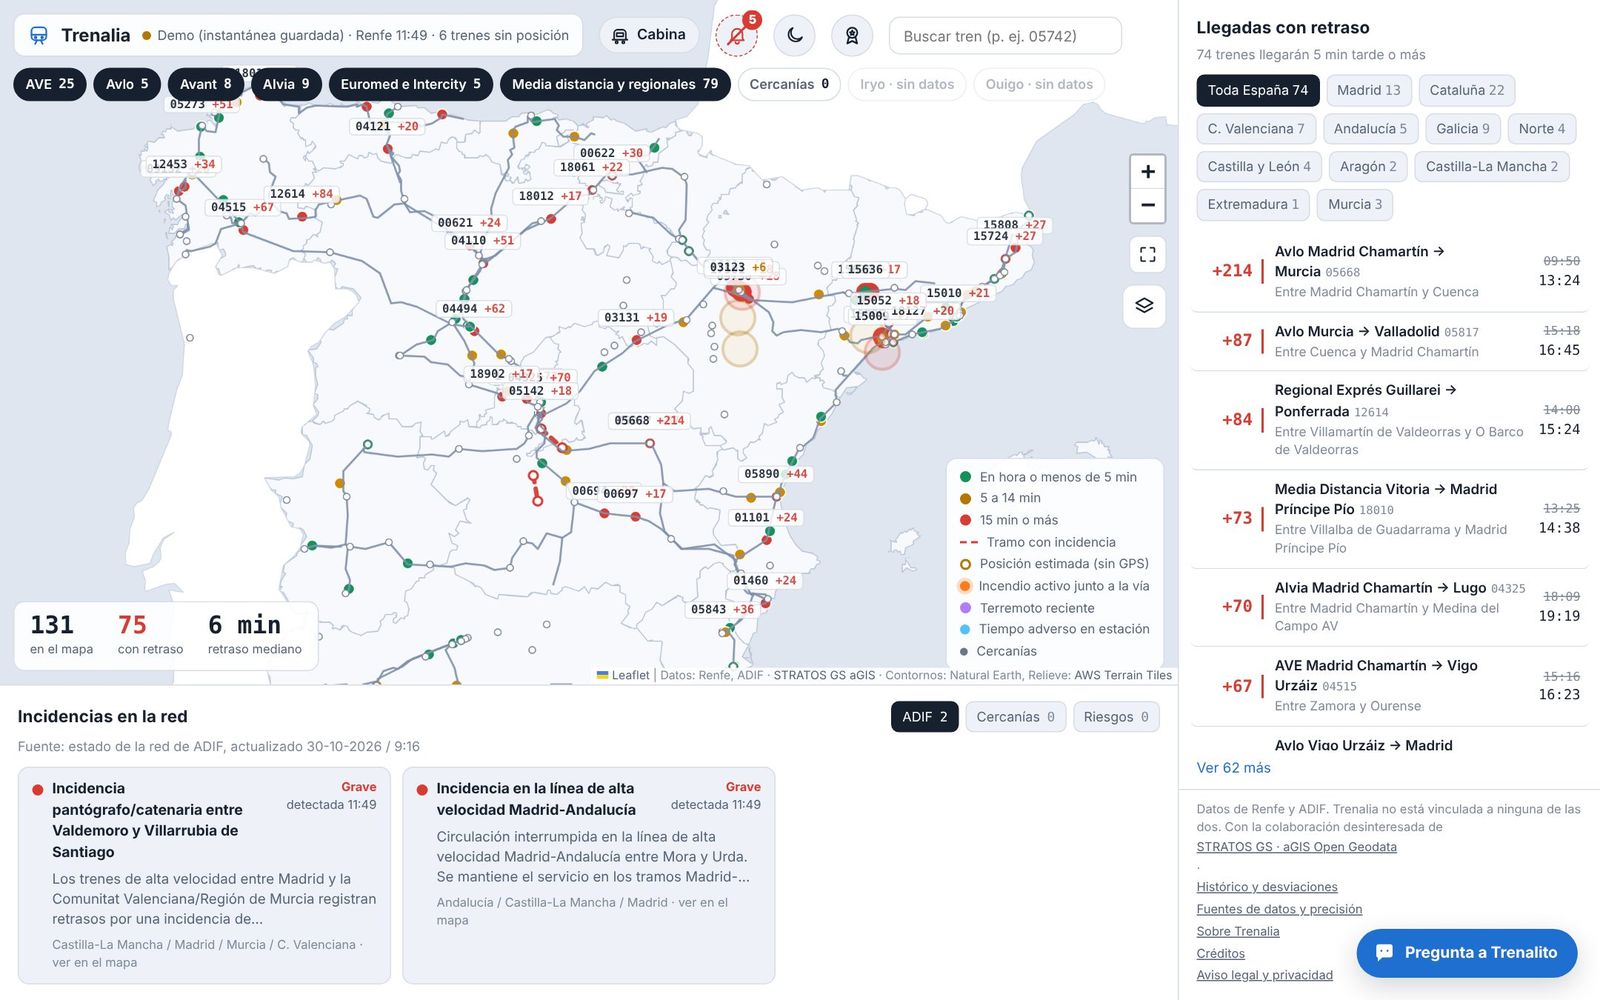
Train positions are on Renfe's live viewer; Iryo and Ouigo delays, on ADIF's station boards; timetables, in official files; incidents, on another page; weather warnings, on AEMET. Trenalia puts it all on a single screen, snaps positions onto the track and makes clear what is data and what is an estimate.
It is a personal project, free and ad-free, designed for people who travel, people who follow the railway as a hobby, people who work in it and people who want to use its data.
One website, on your phone or computer, with six main pieces. Further down you will find them sorted by what you are looking for.
Where every train is and how late it is running, with its position snapped to the track.
Every direct train between two stations on any day, and how to get there with connections.
Departures and arrivals for any station, with countdown, delay and platform.
An assistant you can ask in your own words about trains, delays, timetables and journeys.
Network incidents, weather, wildfires and earthquakes near the line, alerts calculated by Trenalia and incident hypotheses that check themselves.
How each train usually runs, punctuality, monthly reports, API and downloads.
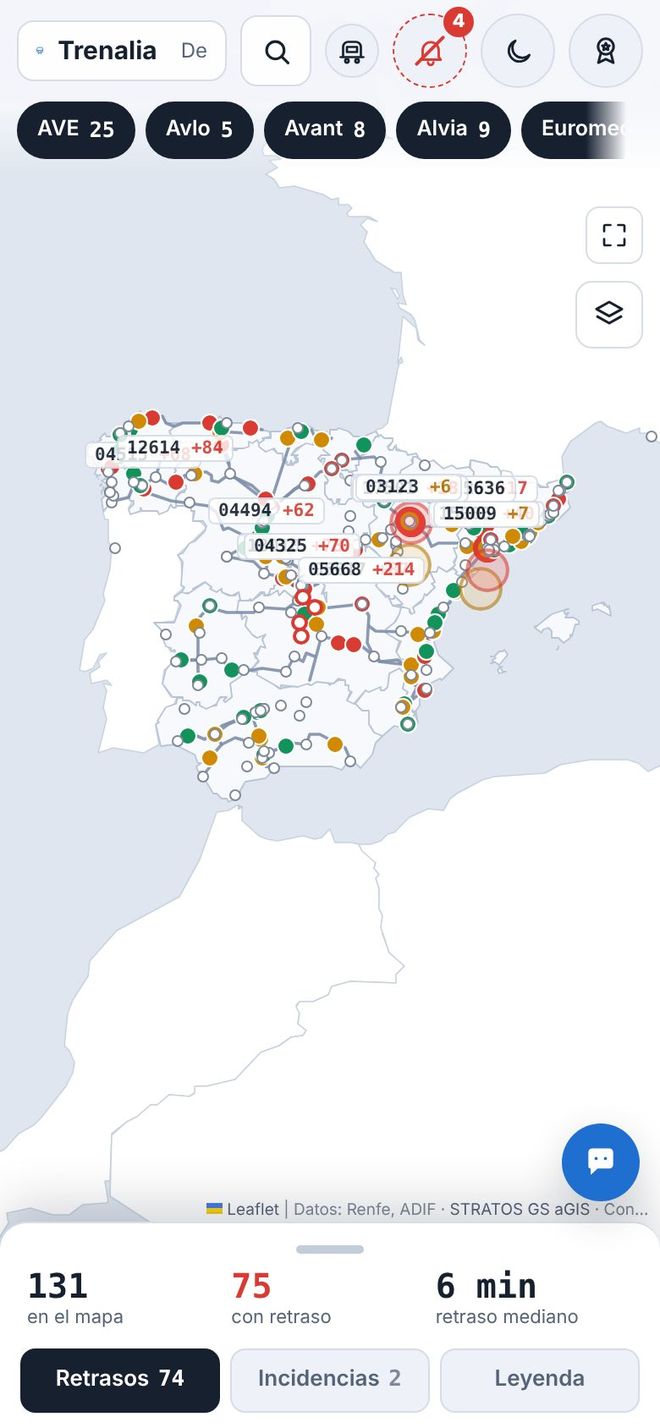
In five languages (Spanish, English, French, Italian and German), with light or dark mode. The map remembers where you left it when you come back from other screens.
New
Trenalia installs as an app straight from your browser: free, without signing up and without going through any store. It opens full screen with its own icon and has shortcuts to “Platform” and “Timetables”.
Without a connection, it shows the last saved copy of the pages you have already visited, with a clear “Offline” notice: that data may be out of date. From the menu you can delete the data stored on your device at any time.
Join the sensor network
Every time you travel, your phone can feel how the train is running: the bumps, the vibrations, the stretches that sway. By pooling what hundreds of passengers feel, we can see sooner which tracks and trains need attention. Nothing to install, no sign-up.
Don’t worry: it’s normal. Every journey has hundreds of perfectly normal noises, bumps and vibrations: points, rail joints, passing trains, braking. Your phone noticing one doesn’t mean anything is wrong. Later, Trenalia puts together the readings from many journeys and studies calmly what might be out of the ordinary.
Your family doctor doesn’t order a CT scan straight away: they ask questions, listen to your chest and check your blood pressure and temperature. If something doesn’t add up, they send you for more precise tests. Trenalia is the family doctor; the infrastructure manager, with its track-recording trains and instruments, is the radiologist who can study it precisely. The advantage: we all carry a stethoscope with us — our phone.
A network this large can’t be checked all at once: you have to know where to start. Just as roads have their accident black spots, millions of measurements from travellers can point to the sections that deserve attention first. A phone is not as precise as a track-recording train, but with enough samples statistics find what a single measurement can’t. That’s why every trip counts: we need millions of measurements.
This map shows where travellers’ phones have already collected data with the on-board sensor. The lit-up areas are the stretches where we are starting to have measurements; the stronger the vibrations collected, the more intense the colour.
It does not mean there is any problem or danger. A more intense colour does not mean the track is in bad shape: the ride depends on the train, the speed, the switches and many normal things. We simply want to share with everyone how the data grows with every measured trip and how important it is to characterise the routes.
Areas of about 500 m with at least one measured pass (what a single train measures appears after 3 hours). Updated every few minutes. No times, no trains and no one’s data.
The screen stays on while it measures. These are citizen indications: they don’t replace inspections or official notices.
New · Game room
A collection of games with real trains, stations and timetables. Manage traffic after a closure, work out what happened on the line from the delays, or get two travellers to their meeting on time. You start as a station porter and can rise to director of the station network.
Short challenges of a few minutes, designed for your phone: between stations you play, learn how a rail network is managed and score points.
Years ago, millions of people let their computer search for signals from space while they weren't using it. Here, while you play, your phone can solve a small piece of a network simulation: the more players, the more hypotheses and problems we solve, and the sooner. Everyone does their bit for scientific computing.
Your phone only receives an anonymous problem to solve: public timetables and numbers, never personal data or sensitive information. And the server checks every result before using it.
This is a game based on open data and estimates: it is not fit for railway operations or safety decisions.
Trenalia's features, sorted by who uses them. Choose your profile:
01
For people who take the train every day or now and then: when it leaves, whether it is late and whether you will make your connection, before you check with your operator.
Every direct train between two stations on the day you choose, grouped into early morning, morning, afternoon and night, with journey time and stops. Past departures are dimmed and the next one is highlighted.
See timetables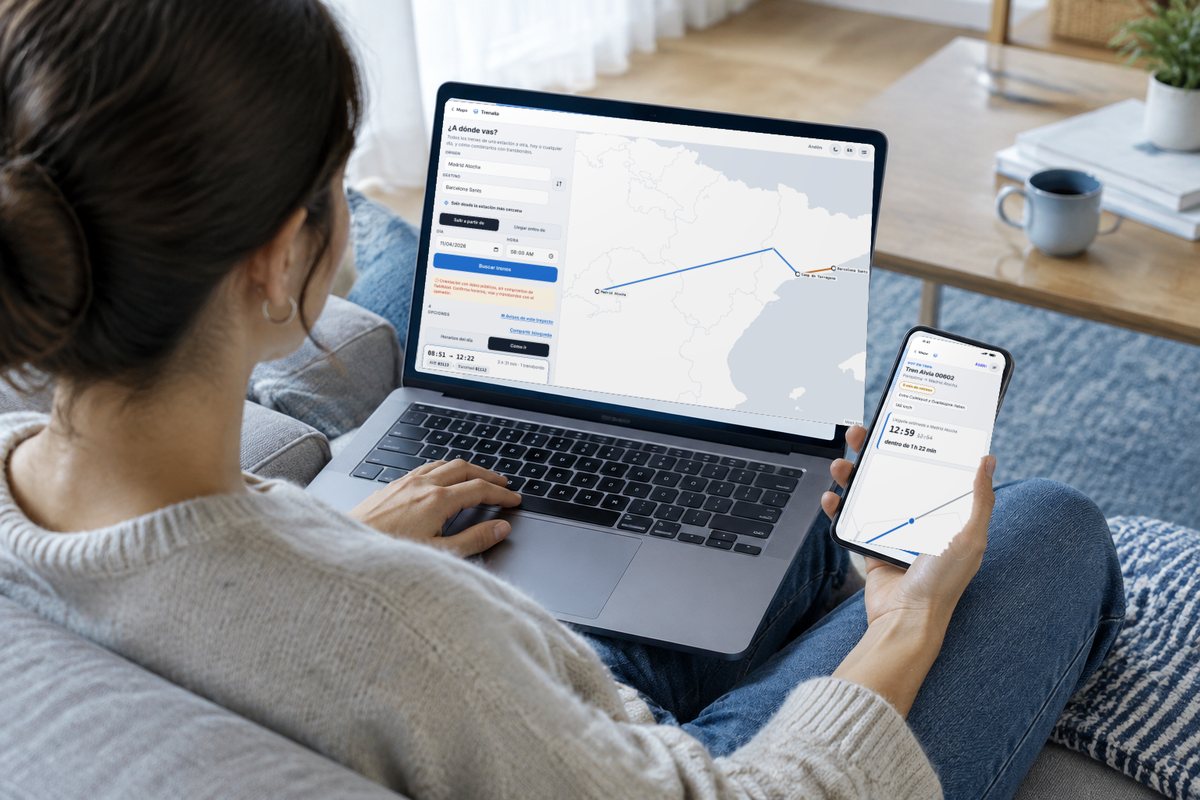
Combinations with up to three changes, with times, the margin for each connection and the live delay of trains already running. You can share the journey or add it to your calendar.
Plan a journeyWith “Set course”, Trenalia stays with you: time and platform before you leave, how far to your stop and a warning if a connection gets tight or is missed, with the option to look for another combination.

Departures and arrivals at your station, or the nearest one, with countdown, delay and platform. At night it already shows the first trains of the morning.
Open the platform viewFollow a train and Trenalia alerts you when the delay reaches the minutes you choose, when the platform changes or when you are close to your station. If you turn on notifications, they reach you even with the website closed (on iPhone and iPad, with Trenalia added to the home screen).
Based on the known delay, what compensation you might be entitled to under the rules published by each operator. It is only a guide: the operator's decision is what counts.
Every delay shows its source: Renfe (the official one), Adif (station boards, for Iryo, Ouigo and other trains without GPS) or Trenalia (projected). Trenalia’s figure is only shown where validation proves it is more accurate than the official one.
Tap a station and see what it looks like from outside, with a free photo from Wikimedia Commons and its author and licence shown.
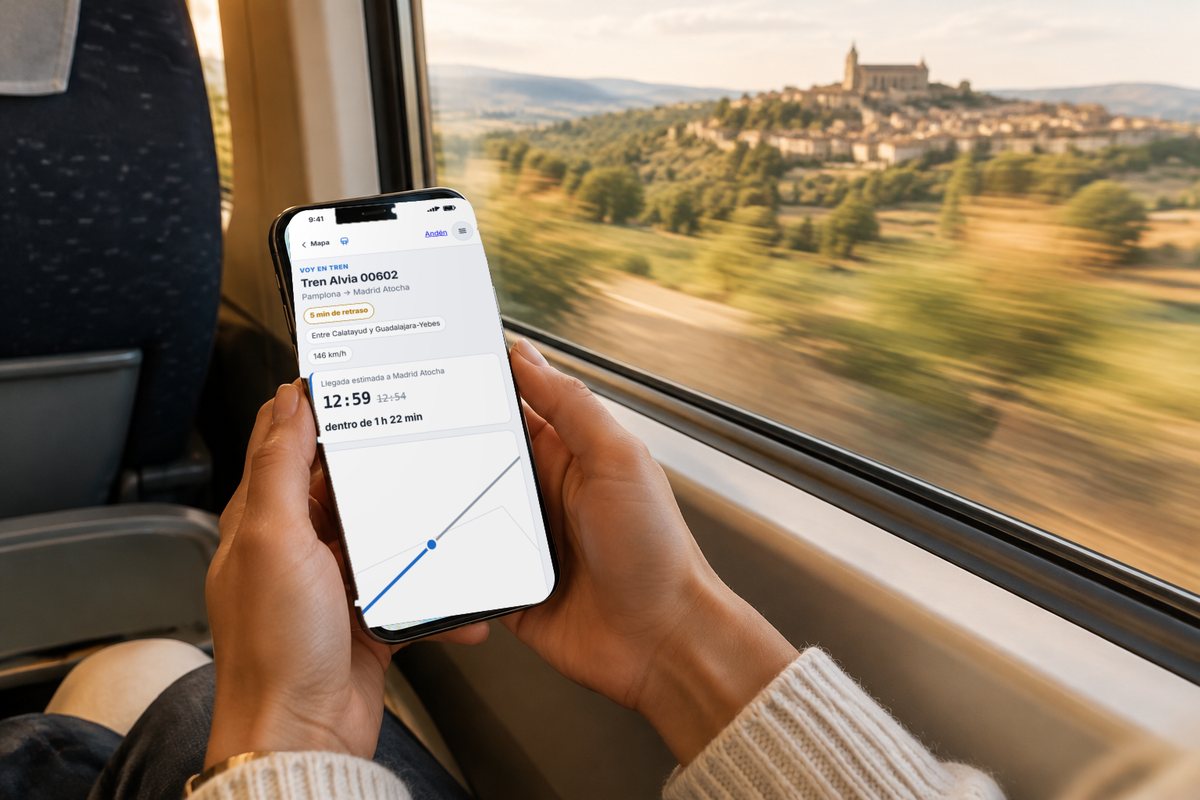
If you are on a train, send your family a short link (by WhatsApp or with a QR code): they will see where you are, the next stops and when you arrive at the station where they are meeting you. They can ask for an alert on arrival and add the arrival to their calendar. No personal data; the link expires on its own.
Try “I’m on a train”Don’t know your train number? In “I’m on a train”, take a photo of your ticket or scan it with the camera, pick the Wallet pass (.pkpass) or upload the PDF the operator sent you: Trenalia finds the train, the day and your stop, and offers the next leg if it is a return ticket. The ticket is read on your own phone and is never uploaded. On Android, with Trenalia installed, you can also send it from your email or the operator’s app with “Share → Trenalia”.
Read my ticketStarted your trip on the computer on the train and getting off to change trains? In “Move to another device” you scan a QR code (or type a code) and your current trip, your trip with changes, upcoming trips and followed trains move to your phone. You can also link both devices for 24 hours so they keep each other up to date. No accounts and end-to-end encrypted: Trenalia can’t read what is moved. And on a trip with changes, “I’m on a train” tells you how much time you have to change and, when you arrive, switches to your next train by itself.
Move to another deviceTrenalia reads the official Cercanías and Rodalies notices and puts them on the map: sections run by bus, closures, single-track working, trains that do not complete their route and planned engineering works. It tells you when you plan a journey (also for another day) and on the station board, together with lifts that are out of order.

Plan a journey (also for tomorrow or next week) or follow someone’s arrival and ask for email alerts: a reminder the evening before and before departure, delays, cancellations, connections at risk and operator notices on your route. You confirm once, unsubscribe with one click and your address is deleted when the journey ends. You can also subscribe to alerts for your commuter line, for a route between two stations (Adif and the operator: closures, buses, faults) or for a train you take often, and to a weekly newsletter with what is new in Trenalia.
Plan and get alerts
“I’m on a train” remembers your trip while it lasts, even if you close the page, and saves it to your history when you arrive: train, route, scheduled and actual arrival, maximum delay and operator notices. For now, only in your browser.
See my tripsIn “I’m on a train” you can leave your phone still on the table (ideally charging) and turn on the sensor: it feels the train’s bumps and vibrations and, by pooling what many passengers feel, sections and trains that aren’t right show up sooner. Anonymous and without GPS; the screen stays on while it measures.
Try “I’m on a train”On your phone, Trenalia now opens a simple home screen: search for your train or station, swipe to choose what to do and see your usual journey. The first time, a short tutorial shows you the basics; the usual map is still in Menu → Full view.
Open on your phone
On the station board you see what connects with the station: airport (Barajas, El Prat, Málaga, Jerez), boat (Bay of Cádiz catamaran, Algeciras ferries) and shared bikes within 400 m with free bikes and docks in real time (BiciMAD, Bicing, Bilbao Bizi, Bizi Zaragoza and more). And nearby metro, tram and buses with their next departures, real-time delays where the operator publishes them and their notices (Madrid, Basque Country, Valencia, Alicante, Málaga, Seville, Granada, Zaragoza, Murcia, Barcelona and Mallorca), long-distance departures from the nearby bus station (ALSA, Daibus, Avanza, Samar…), Baleària ferries from the port, the Barcelona metro (TMB, via T-mobilitat) and nearby car parks with free spaces where the city council publishes them (Málaga and those on the DGT platform).

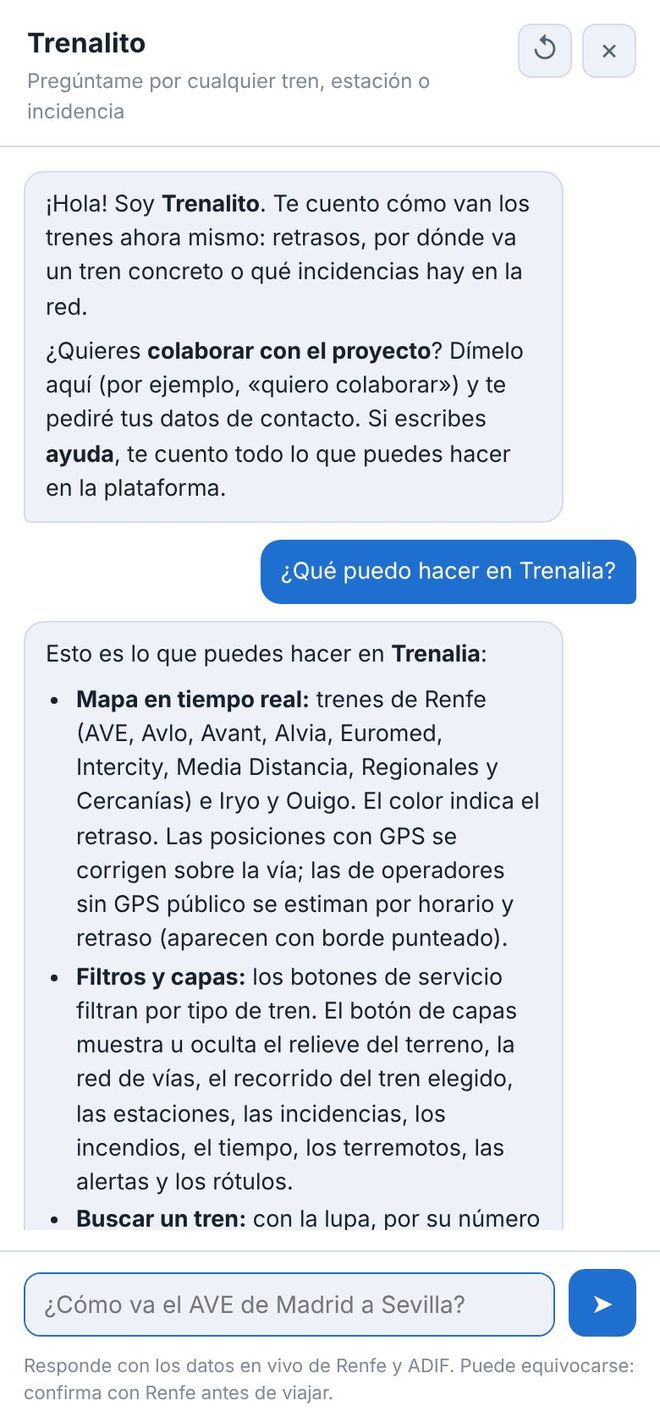
Write the way you talk: “How do I get from Madrid to Seville tomorrow?”, “Timetables from Atocha to Aranjuez this afternoon”, “Are there any incidents in Catalonia?”. It answers with timetables and live data, takes you to the page with all the options, and you can rate each answer with 👍 or 👎.
It uses artificial intelligence (Claude, by Anthropic, with backup providers) and can make mistakes. Conversations are not stored; if you rate an answer, the question is saved without personal data to improve the assistant.
Talk to Trenalito02
For people who enjoy watching the network move, or simply want to know which train just went past their window.
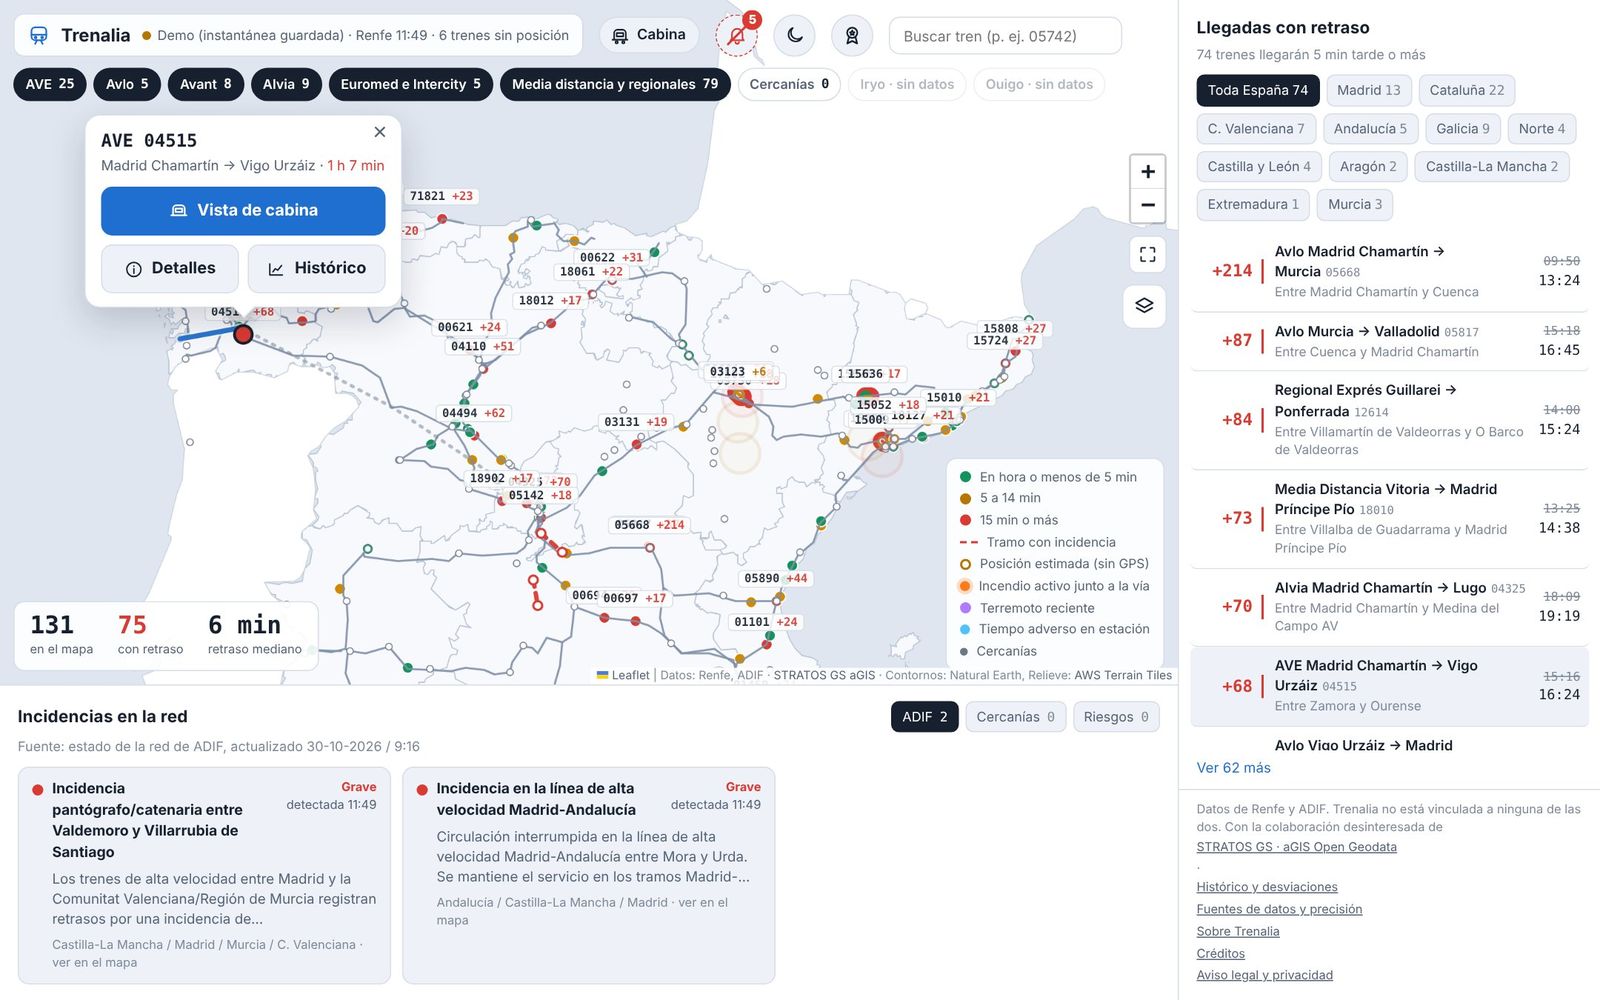
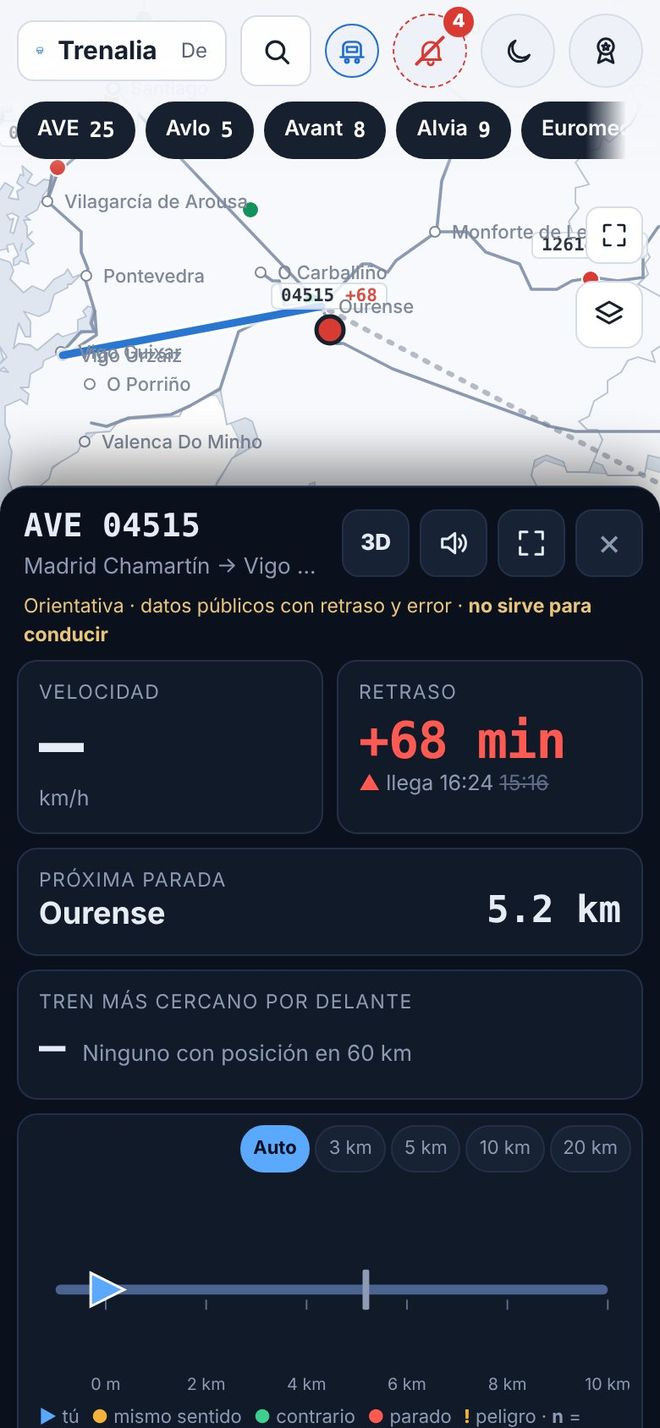
AVE, Avlo, Alvia, Euromed, Intercity, Media Distancia, regional, Cercanías and Rodalies trains, coloured by delay, with filters by service and by region.
Open the mapRenfe's GPS is snapped to the real track and smoothed. Trains without public GPS, such as Iryo and Ouigo, are estimated from their timetable and drawn hollow. Every position shows its uncertainty.
Stops, timetable, delay, platform and position accuracy. Its route is drawn on the map: the part already covered in grey and what is still ahead in blue.
What lies ahead of and behind the train: other trains, stations, incidents and hazards. With the gradient profile calculated from the IGN terrain model and a 3D view with the relief.
FGC and Metro Bilbao trains, Euskotren delays and the status of each Rodalies line. Layers for infrastructure (single or double track, electrification, gauge, ERTMS, maximum speed), relief, weather, wildfires and earthquakes.
Look up a train and compare today's delay with its average over previous days, stop by stop.
See the historyHover over a station (or tap it) to see its photo and the essentials; under “See the station”, its data sheet: opening year, tracks and platforms, lines, accessibility and sources. With Adif’s stations on the map from the start.
Open the mapThe “Track” layer shows the gauge changers across the whole network and, up close, OpenStreetMap’s switches, track crossings and buffer stops, each with its explanation.
See the “Track” layerThe cab view is for guidance only: it uses public data with delays and a margin of error. It is not for driving trains.
03
For people working at operators, in logistics, freight or passenger services: an overview of the network with measured history and the sources in plain sight.
Share of arrivals with 5 and 15 minutes' delay or less, by product, time of day, day of the week and route, over 7, 30 or 90 days.
See punctualityThe sections between stops where trains lose or recover the most time, with the option of drawing them on the map.
Every ADIF and Cercanías incident from start to finish, with its cause, its duration and an estimate of the trains affected and the minutes accumulated.
The month's punctuality by product, corridor and week, worst sections and incidents, compared with the previous month. Print it, save it as PDF or download it as CSV.
See the reportTrains per operator on 14 corridors, a freight market panel with official CNMC figures, and network parameters useful for freight (axle load, loading gauge and maximum train length).
Every hour the official timetables are compared to detect trains that have been cancelled, added or rescheduled for today and the coming days.
Renfe does not publish the delay of each commuter (Cercanías) train: Trenalia measures it by matching its GPS with the official timetable, stop by stop. By hub and line, with time of day, day of the week and recurring patterns.
A map layer, hidden until you turn it on, with possible incidents detected live and the trains likely to be affected.
How they workUnder construction
Try more trains per hour, different signalling, a speed restriction or a closure on a corridor, and see the knock-on effect on delays and occupancy. Access on request.
About the simulationDelays and incidents by train model and by individual unit (its number, e.g. 449-018), compared with the others on the same corridor so the train isn’t blamed for what belongs to the track. In the API and the MCP connector.
See the APIThe analysis is in the map's ☰ menu → “Analysis”. Punctuality is measured with Renfe trains that publish GPS; the impact of incidents is an estimate by Trenalia, not official data.
04
Everything the website shows is also available as data, to build with, study or report on what happens on the network. Just credit the source.
# Public API, no key
GET /api/v1/trains?min_delay=15
# MCP server for AI assistants
https://trenalia.org/mcpRead-only, no key and with CORS: trains, stations and their boards, incidents, hazards, alerts, timetables and journeys. Documented with OpenAPI, with texts in five languages.
See the documentationTwo connectors for Claude or any other MCP-compatible assistant: the public one, with more than 30 tools (everything the website shows: trains, boards, journeys, punctuality including Cercanías, incidents, hypotheses and validation), and the simulation one, for approved users, with an API key or OAuth.
How to connect itMonthly CSV downloads of journeys, sections and incidents, under a CC BY 4.0 licence and without personal data. Also feeds in GTFS‑Realtime format.
A station's departures or arrivals, ready to embed in any page with an iframe, in light or dark mode and in five languages.
How accurate Trenalia is: the delay shown compared with the observed arrival, the status of the models and the outcome of the alerts.
See the validationFor people collaborating on the analysis: journeys, stops and time per section, with each day’s planned timetable, the official sections with their line and kilometre point, incident hypotheses with predicted versus observed, alerts and stops, with their dictionary. Filter by train, station or corridor and download as CSV or JSONL from the simulation or through its MCP, with a permission granted by the controller. No personal data.
Request access to the simulationA “?” button next to each part of the simulator explains what it is for and how to read the result, and a full manual with search brings together everything you need to simulate and to work with the data. Claude can also look it up through the connector.
Go to the simulation05
A view of the network in context, to understand what is happening and where, alongside the official channels.
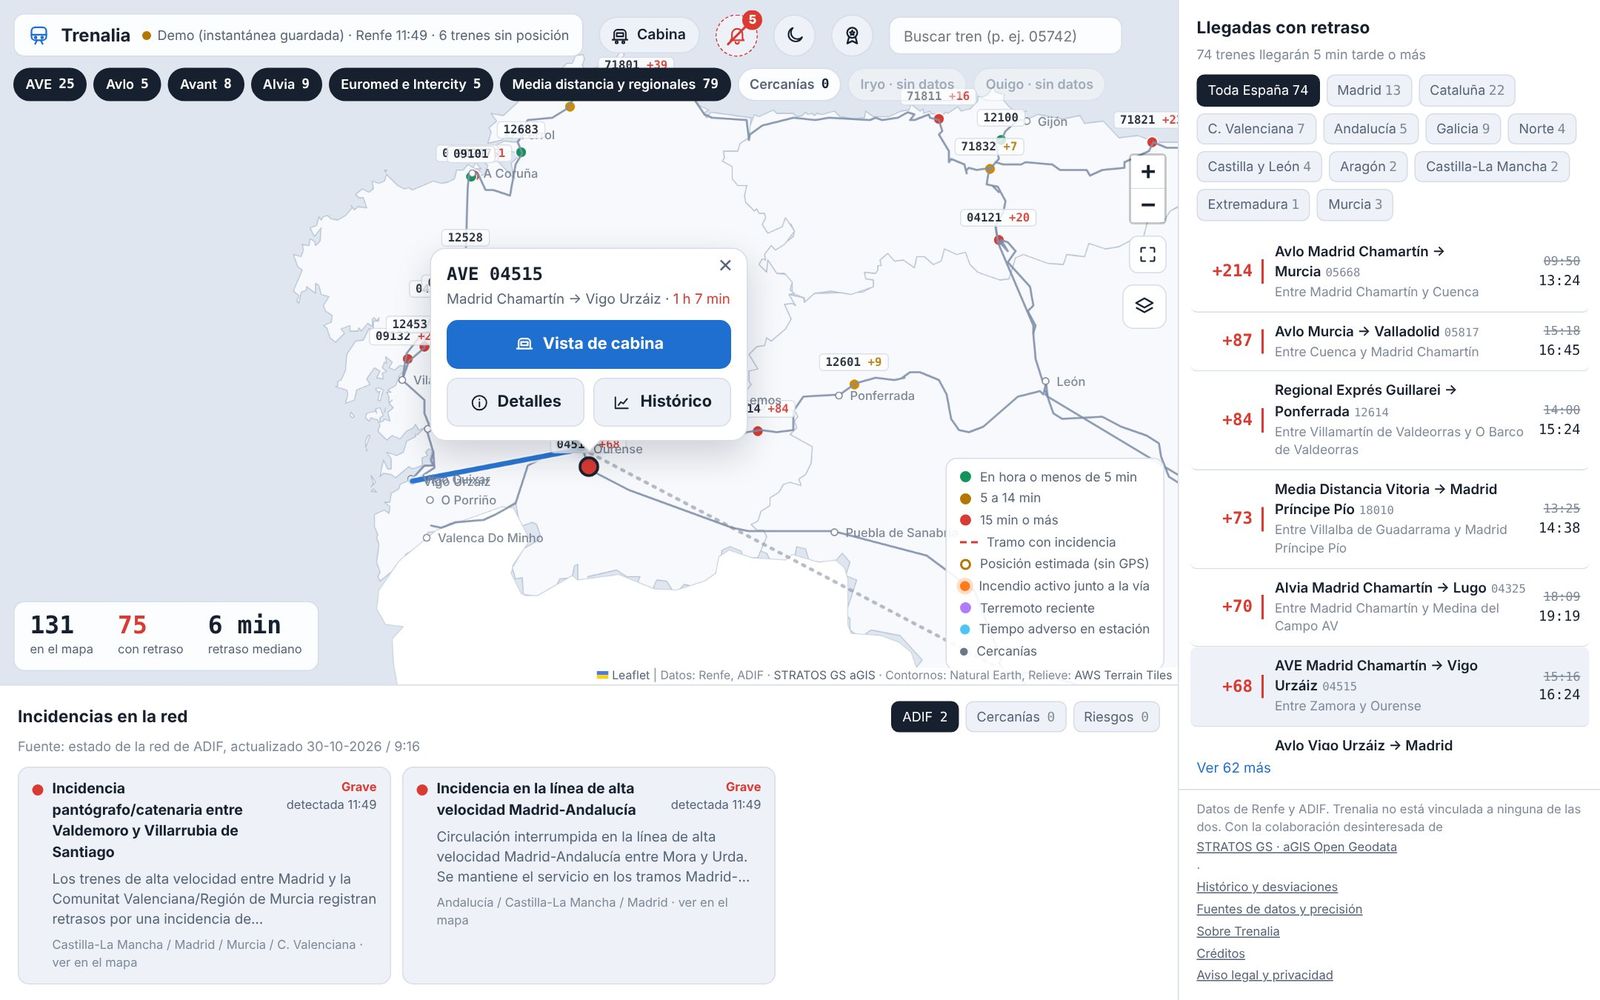
Trains, delays and incidents across Spain on one screen, with the trains that will arrive late grouped by region.
AEMET warnings, wildfires detected by satellite, fire danger, earthquakes and road closures near the line, with the trains that will pass through in the coming hours.
Stopped or very slow trains, sudden jumps in delay, possible temporary speed restrictions and abnormal drops in electricity demand as a warning sign.
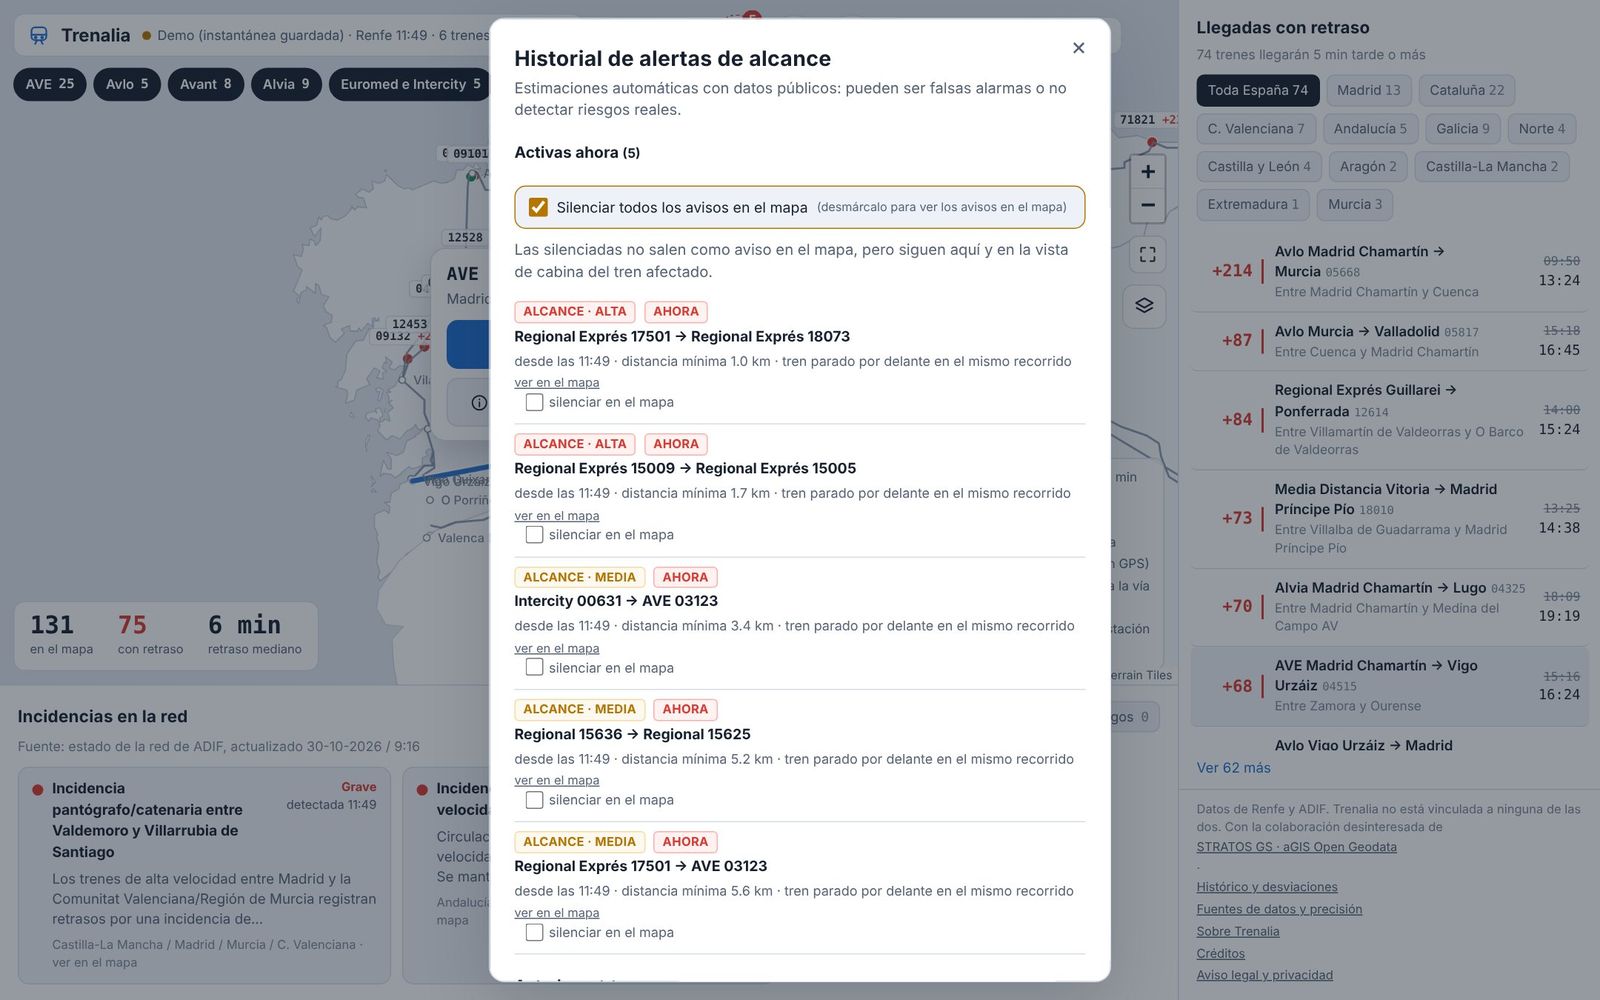
When two trains with a reliable position get too close on the same line, with a review of what happened afterwards. By default they do not pop up on the map; the bell keeps the active ones and their history.
Under construction
Before engineering works, a closure or a timetable change: estimate with open data how many trains and lines would be affected, and by how much. Access on request.
About the simulationThese are estimates by Trenalia using public data, without access to signalling: there may be false alarms. They are not ADIF warnings and are not for railway safety.
New
Under construction · access on request and approval
What would happen if…? Pick a line or a corridor and a day: in the past, with the delays that were actually observed, or in the future, with a projection based on how its trains usually run. Change something and see how it spreads through the network, train by train.
Access is by request only: every request is reviewed and, if approved, you receive personal credentials to sign in.
Example: what would happen if…?
IllustrativeIn the past, each train starts with the delay it really had, and the model is checked against what was observed. In the future, with its typical delay over the last 30 days.
Average delay by hour, before and after the change; the occupancy of each section hour by hour with the UIC 406 method; and a tree of chained effects showing which trains and lines are affected, and by how many minutes.
Punctuality and time losses of lines by signalling system: ERTMS, LZB or ASFA. It compares lines, not systems: each line also has its own alignment, traffic and trains.
Freight and other trains with no public data are estimated from recurring time losses that no visible train explains. Always aggregated by section and hour, never in real time.
Operators, public administrations, consultancies, universities and media who need to study the capacity and punctuality of the network with open data.
A time machine on the map: move forward 5 minutes at a time and see which train is waiting for which, and why (headway, single track, rolling-stock turnaround or a full station). Compare three layers: what really happened, the plan without changes and what would happen with your changes.
Runs the simulation up to 100 times with variations learned from history and gives a range (p10–p90) and the probability that each train gets worse, not a single number.
If a train arrives late, the next one leaving with the same rolling stock is delayed too; and if a station is full, the next train waits outside. Turnarounds are learned from history.
Upload your delay model in PMML, ONNX or WebAssembly and compare it with the built-in one, which is retrained every night with machine learning. It runs isolated and with limits.
Once your access is approved, connect Claude or another assistant over MCP with your API key or OAuth: search corridors, run and compare scenarios, use the scenarios you saved on the website and manage your models, all in conversation.
Inside the simulator, Trenalito answers your questions about using it, with the simulator manual and what you have on screen: what to change, how to read a result or why something failed.
Large simulations, with hundreds of runs to see the range of what's likely, are shared out to the phones of people playing in the «Stationmaster» room, as the SETI@home screensaver did. Whoever runs the simulation sees how many phones are helping and the estimated time. This way Trenalia can serve many more simulation users without adding servers.
Phones only receive an anonymous problem (public timetable and numbers), never who's asking or personal data. Each result is checked on the server, and if a phone is slow, the server computes it: nothing gets slower or fails because of it.
New
Every night Trenalia reviews the previous day’s delays, recognises the situations that caused them (a broken-down train, a closure, slow running or a congested section) and simulates them again to see whether it reproduces them. From that it learns patterns. When it sees something similar live, it publishes a hypothesis: which trains are likely to be affected and by how much.
The first time it reviews the whole history; after that, the previous day. Each pattern has a confidence level that goes up or down with every hit or miss.
With a stopped train or several trains in trouble on a section, it simulates from that moment and shows the trains likely to be affected, with their probability and minutes. If it matches an official Adif or Renfe notice, it says so.
After 3 and a half hours it compares the forecast with the actual delays. Hypotheses are shown as “under study” until the maintainer validates their pattern; then they become “possible incident”.
If you are on one of those trains, you can say “I confirm” or “No, my train is fine”. It is anonymous and your IP is not stored. The hit rate is published on the validation page.
They are estimates, not Adif or Renfe notices. See how often they are right
Ratings from the people who use it, with no accounts and no personal data.
Once a week, a short email with what is new for better train travel. No ads, unsubscribe in one click.
Subscribe to the news What’s new →Important alerts, major delays, news and game challenges, also on your social networks.
This is a possibility to explore with the operators and ADIF, not a guaranteed result.
Trenalia does not replace official channels, signalling, operating instructions or operational communications. Before you travel, check with your operator. In an emergency, call 112.
Feedback from users, the experience of people who work in the railway and data from those who hold it all help make Trenalia more useful. This is how it moves forward:
Tell us what is missing, what is unnecessary and what is unclear.
Find more sources and better access to cover more trains.
Check the results with professionals to improve quality.
The button opens Trenalito on the map, which will ask for your contact details.
If you take the train to class, share it with your classmates. Download the A4 poster with the QR code to print and put up at your school, university, residence or station. The poster is in Spanish.
Download the poster (A4 PDF)So that rail information reaches the people who need it, better.